 |
| Capacity planning performance monitoring |
What is capacity planning?
Capacity is the extreme amount of work that can be round off in a given period. Capacity and performance are always mentioned together. Capacity means the ability to process and store data without congestion or impact to the end-user, Capacity Planning, and performance monitoring work together to give the staging of your hardware and software life cycle.
There are important parameters that determine the capacity of a system
CPU LOAD
# uptime
The uptime command can be used to see how overlong the server has been running and how
many users are logged on, as well as for a quick rview of the average load of the server
 |
| Capacity planning performance monitoring and tuning |
# iostat -c
The iostat command exhibits average CPU times after all the system was started. It also creates a report of the task of the disk subsystem of the server in two parts: CPU utilization and device (disk) utilization. To use iostat to perform detailed I/O stoppage and performance tuning
 |
| Capacity planning performance monitoring and tuning |
% user – This value constitutes the percentage of CPU used when the application is run at user-level processes run by normal user accounts
% nice – usually run statements by users with nice commands to change CPU process priority
% system – This value constitutes the percentage of CPU used by kernel processes.
% iowait – This value constitutes the percentage of CPU used when the CPU is waiting for disk I / O operation to complete before moving on to the next action.
% steal – This value is only correlated with virtual CPUs. In some instances, the virtual CPU must wait for the hypervisor to process requests from other virtual CPUs. This value specifies the percentage of time the hypervisor waits for the virtual CPU’s request to process.
% idle – This value constitutes the percentage of CPU time not processing any request? Sit and play
# vmstat
vmstat build information about processes, memory, paging, blocks, traps, and CPU
job. The vmstat command show either average data or actual samples. The sampling
mode is allowed by vmstat with a sampling frequency and a sampling duration
 |
| Capacity planning performance monitoring and tuning |
Procs r: The volume of processes waiting for runtime process
b: It is the number of processes in continuous sleep
Memory swpd: The number of of virtual memory used (KB)
free: The amount of idle memory (KB)
buff: The number of memory used as buffers (KB)
cache: The number of memory used as cache (KB)
Swap si: number of memory swapped from the disk (KBps)
so: number of memory swapped to the disk (KBps)
INPUT/OUTPUT bi: Blocks forword to a block device (blocks/s)
bo: Blocks collect from a block device
System in: The amount of interrupts per second, including the clock
CS: The number of setting switches per second
CPU percentage of total CPU time
us: Time spent running non-kernel code user time, counting nice time
sy: It is time spent running kernel code system time.
id: Time spent idle. this included I/O-wait time.
wa: Time spent waiting for IO. this appeared as zero.
-m show the memory utilization of the kernel slabs
-a the information about active and inactive memory pages
-n display only one header line.
When used with the –p partition flag, vmstat also provides I/O statistics.
DISK MONITORING
iostat -d
The iostat command appears average CPU times after all the system was started. It also creates a report of the task of the disk subsystem of the server in two
parts: CPU utilization and device disk utilization
 |
| Capacity planning performance monitoring and tuning |
NETWORK MONITORING
# netstat
netstat is one of the most popular tools. If you work on the network. you should be familiar
with this tool. It displays a lot of network-related information such as socket usage, routing,
interface, protocol, network statistics, and more.
-a Show all socket information
-r Show routing information
-i Show network interface statistics
-s Show network protocol statistics
 |
| Capacity planning performance monitoring and tuning |
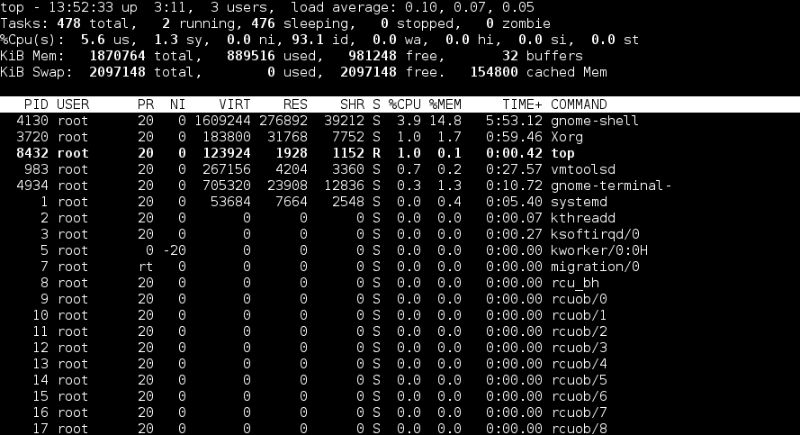
TOP MONITORING TOOL
# TOP
The top command shows genuine process activity. By default, it displays the most
CPU-rigorous tasks running on the server and updates the list every five seconds. You will
sort the processes by PID number, age newest first, time cumulative time, and
resident memory usage and time
 |
| Capacity planning performance monitoring and tuning |
PID Process identification.
USER Name- of the user who allow the process
PRI Priority of the process.
netperf Network performance benchmark
NI Niceness level Whether the process attempt to be nice by adjusting the priority
by the number given
RSS number of physical RAM used, in kilobytes.
SHARE number of memory shared with other processes, in kilobytes.
STAT It is the State of the process S=sleeping, R=running, T=stopped or traced,
D=interruptible sleep, Z=zombie.
“Process state”
%CPU It means percentage of Share by the CPU usage since the last screen update
%MEM Share of physical memory.
TIME Total CPU time used by the process after all it was started.
The top utility supports several useful hotkeys, including:
t Displays summary information off and on.
m Displays memory information off and on.
A Sorts It display the system resources. Useful for
quick recognition of performance tasks on a system.
f Enters an interactive configuration screen top. Helpful for setting up top
for a specific task
.
o Enables you to collectively select the ordering within the top.
r Issues renice command.
k Issues kill command.


2 Comments
Click here for CommentsThank you so much, ur blog is very useful....
Replythanks
Reply